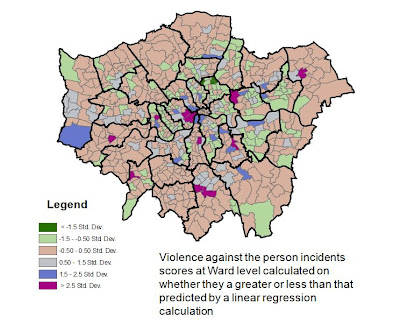
This is the graph and map following the methodology of the previous post. The correlation is almost exactly the same as the robbery data arrays at 0.55 and 0.67 when the two West End outlier wards are removed. This raises the intriguing possibility that robbery incidents can predict violence incidents and visa versa.
Search This Blog
Tuesday, 28 September 2010
Robbery incidents can predict violence incidents and visa versa
This is the graph and map following the methodology of the previous post. The correlation is almost exactly the same as the robbery data arrays at 0.55 and 0.67 when the two West End outlier wards are removed. This raises the intriguing possibility that robbery incidents can predict violence incidents and visa versa.
Subscribe to:
Post Comments (Atom)


No comments:
Post a Comment