The above shows the result of the Ward Hierarchical Cluster method. It is exactly the same as the Centroid Hierarchical Method except it uses the squared Euclidean distance as a measure of variance between clusters and within clusters. At every stage it forms a cluster of forces whose distances apart have the minimum deviation from the mean (average) distance from a centroid that could be created at that stage and the maximum deviation from any other centroid that is already present or could be created at that stage. It uses a calculation known as Sum of Squares. The formula can be found
here and an explanation of how it fits into the logic of statistics, such as standard deviation
here
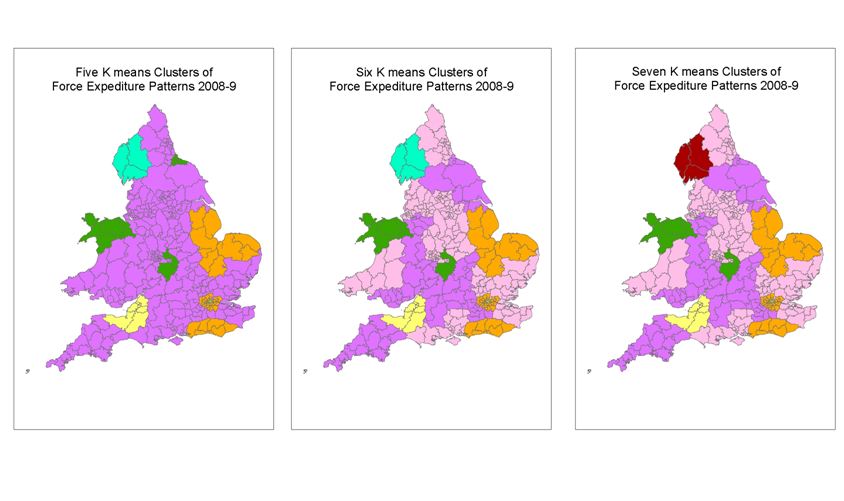
K-means is another clustering method. It is not hierarchical which gives it less rigidity and more flexibility. It uses the same measure as the Ward method but its process is different. The users have to nominate how many clusters they want to be formed. The computer then puts that number of centroids, in our case in the 28 dimensional space, randomly (though in SPSS 17 it is always the same places as the results are always the same if the order of the forces is the same). The computer, through a number of tries or iterations, attempts to achieve the Sum of Squares minimisation within clusters and maximisation between clusters discussed above until it can do no better. You can see the non-hierarchical flexibility with Cleveland (in the North East) starting purple, going green, then going back to purple; something that is not possible using a hierarchical method.


No comments:
Post a Comment