This blog entry is dedicated to my colleagues in CASA, especially Andy Hudson-Smith, Ollie O'Brien and Fabian Nuehaus.Yesterday I collected data from CASA's weather station for the 2009 calendar year. I have collated it for analysis and these are my first results.
The reason why I have written a blog entry for three weeks is that I have been writing a paper entitled `A Geographical and Temporal Analysis of Violent Crime in London in 2009' which hope to submit to a journal for publication. This has switched me on to the characteristics of violent crime that are different to other crimes. One of things I noticed was the affect of events such as New Year's Day had on violent incidents but also the weather.
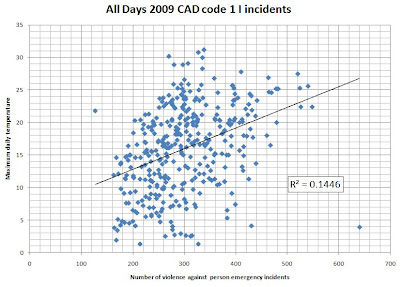
I thought I would look into the weather aspect a bit further and I am able to thanks Andy and Ollie. The graph above does not look to promising. It shows the maximum temperature for each day in 2009 on the y-axis and the number of incidents that were allocated a code 1 class 'violence against person` and graded as an 'I` or emergency call on the x-axis. The result shows a very weak positive correlation. Nothing to get too excited about there then.
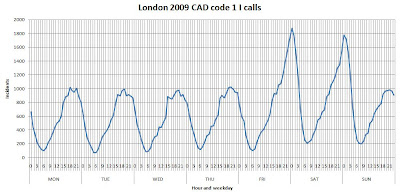
This where I thank Fabian for helping me to regard everything in police data as monitoring a machine (or a body) that has rhythms and cycles. Police incident data has rhythms and cycles that you can set your watch and calendar by.
You can see that number of calls is affected by the day of the week. Working on the hypothesis that the rhythms and cycles of London that are reflection of people's work/leisure routines have a greater influence than weather I negated much of this variable by just using Saturday data. I tried various combinations of weather data including average daily temperature and various different CAD codes in combinations or divisions. The best correlation I found was with CAD code 1 emergency calls and maximum temperature.
An R squared of 0.4417 means that temperature is not the only influence on violent incidents, holidays, celebrations, special events all play their part. These in some cases may be a contributory mechanism by which temperature is an influence, (eg hot May Bank Holiday weekends) and in others may be a negative influence (eg colder New Year's day( not on a Saturday in 2009) or Halloween). In any case the R squared value represents a correlation of 0.6646 which is generally regarded as significant in social sciences.


No comments:
Post a Comment