Search This Blog

Sunday, 24 October 2010

Zooming in on Firearm crime locations in London

Recorded Crime in London in 2009 involving firearms showing recorded Ward location

Legend - Number of crimes
Following on from the previous post I am showing the same data as the second at council ward and grid level. What I forgot to mention is my classification of quantities uses equal intervals with 0 excluded for all the maps; I have also tried to use the same clours so that they can be compared.


Recorded Crime in London in 2009 involving firearms showing recorded grid square location
Legend - Number of crimes

Recorded Crime in London in 2009 involving firearms showing recorded grid square location - Zoom detail
The interesting aspect of these maps to me is the borough of Haringey (top centre of zoom grid map). The borough map published yesterday showed that Haringey is not in the top four boroughs ranked by number of crimes but it has a ward that is ranked number 2 and a grid squre that is ranked number 2 which is not located within the second ranked ward! 

Saturday, 23 October 2010

Firearm Crime, the problem of counting and location discussed


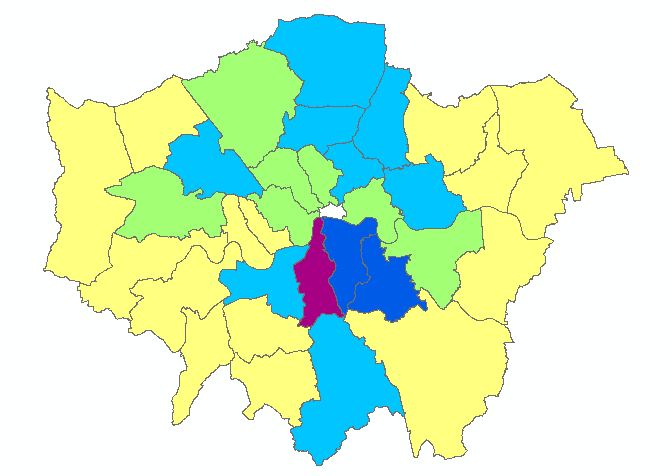
Recorded crimes involving firearms in London in 2009 showing Investigating Borough

Legend - Number of Crimes
Following on from the previous post I am answering the question "Where do these crimes occur?" I am in danger of immediately confusing you when answering this question. There is an assumption with crime mapping that a crime happens in a specific place at a specific time. This of course is not always the case. The commission of a crime can happen over a long period of time in many different places.  Good examples are possession of illegal drugs or driving a stolen car. The location and time of a crime are usually recorded where they are discovered. What about internet related crimes, where are they committed, in cyberspace or the location of the victim, if there is one, or the location of the perpertrator, if that can be discovered? So one way of answering the question is which police "own" the crime and are responsible for investigating it. This is usually to do with physical location of the crime but when this is not easy to establish or where there are many locations then the Home Ofiice rules apply - which defaults back to where it has been discovered or first reported to police if no other rule applies.

So the first map above answers the question by saying which borough police are responsible for investigating and recording the crime. This has been worked out based on a data set of 5587 crime incidents. You notice that in the previous post the total of offence is 5648 - a difference of 61. This is to confuse you further and to further illustrate that numbers are rarely simple with crime counting, this is because on rare occassions the same incident is recorded as more than one offence. This is unusual at the initial reporting stage (which my data set is obtained from) but happens quite often when a crime has been solved and further offences can be added, thus helping the clear-up figures, but that is a different story.


Recorded crimes involving firearms in London in 2009 showing recorded location 

Legend - number of crimes
Whichever way the crimes are counted London is fortunate in having a low level of crime which involve firearms. The most dangerous boroughs appear to be Lambeth, Southwark, Lewisham and Hackney.

Friday, 22 October 2010

Firearms and violence

Yesterday the Home Office produced another publication updating the  Official Crime Statistics. These are based on the British Crime Survey and Police Recorded Crime. The publication can be found here. As usual this is a high quality document. I thought I would provide some alternative figures regarding violent crime because, as I have discussed before, a lot of violence does not fall within Home Office Crime Type 1 - violence against the person.

The table above shows all crime recorded by the Metropolitan Police Service, (which polices London) in 2009 that involved a firearm in the offence. On intial classification there were 5648 such offences. The tables show exactly what the offence is and which Home Office Crime Type they are categorised in. I think most people in the UK would think that offences involving firearms are the most violent of violent crimes. OK there may be a few technical offences in this lot that do not actually involve violence but the vast majority are really nasty crimes. Only about 40% are included in Home Office Type 1.

Monday, 18 October 2010

A good use of Twitter

Police have a difficult job there is no doubt about that. One of the difficulties they have is showing what an effective job they are doing day to day. I am afraid that by trying to show, often falsely, that crime and disorder is low they are doing themselves no favours because it undersells their essential value to vast areas of the UK. The fact is confidence in police is tied up with the public's demand on them. High demand means the public think police are there to help them and that the police have the ability to meet those high expectations. As a police officer I have dealt with all sorts of incidents that can be argued  are not core policing duties but I was brought in the British Policing tradition that the police are essentially there to serve - thus the word Service  in Police Service. Even the application of force, arrest etc. is done with motive of service to society as a whole.

This is where the crime maps that the British Police produce have got it wrong because they do not show the police activity that goes on. That is why I think Chief Constable Peter Fahy of Greater Manchester Police has got it completely right by using Twitter to publicize the volume and variety of incidents in a 24 hour period. The results can be found here and here.

It appears Greater Manchester get about 3000 incident calls a day. As a retired Metropolitan Police Officer from London I think it is my duty to point out this is about a quarter of the calls the MPS deal with in a day.

Friday, 15 October 2010

Populating the grid squares


I am reasonably happy with the results shown above. This is populating my grid squares with human residential population data obtained from the Office of National Statistics 2001 census. I have used a similar technique to that which I discussed with IMD scores in my last post with a few variations. Firstly I have used population data from the smallest census unit, the Output Area(OA). There are 24140 OAs in London which is a remarkably similar number to the 26116 grid squares, but OA are based on a residential poulation of about 300 people and therefore are of vastly varying sizes. I have experimented using average numbers of people but this gives a highly inaccurate result because there is a bias to OAs with large spatial areas as the grid squares falling within them all having the value of the OA which instead of being counted once will be counted many times. So instead I have gone for average density (remembering that to go via the average number of people and average area rather than averaging the individual densities) to counter-act the area bias. When added all togeather there is a resulting error of about 10% too high a population and about 30% too high an area resulting an average density in London of about 37 people per hectare rather than about 47 which the actual data supply a resultant error rate of about 20%.

This is acceptable to me because (a) the 2001 data is dated (b) the relationship between residential population and crime and disorder I have already argued on this blog is not straight forward.

The naive smoothing is there (this is what causes the error) but to me it is intuitively more of an advantage than a disadvantage.

What is possible from the Census Data is use different age groups in the population. These are what the following maps represent.


0 to 15 years old inclusive


----------------------------------------------------------------------------------

16-29 years old inclusive


------------------------------------------------------------

30-59 years old inclusive


---------------------------------------------------------

60 years old and older


Mapping scale and IMD again with a difference

This is a map of London displaying the the Indices of Multiple Deprivation 2007 scores (higher the score -purple - the more deprived). These are aggregated at Lower Super Output Area scale. I have used a geometric interval classification in ArcMap as it seemed to provide a better split of colours on this and other maps in this post. The explanation for geometric classification, such as it is, is here. This recommends displaying a histogram of the distribution so here it is.


The point I with to make is that the map that is created shows LSOAs next each that are either end of the deprivation scale. This can be seen in the map below;


Now I need to transfer the IMD scores from LSOA to my grid squares. There are 4760 LSOAs in London (5 more in the City of London) and there are 26116 grid squares so many grid squares fall completely within a LSOA: these in my calculations are allocated the IMD score of the LSOA it falls within. Others fall across two all more LSOAs: these in my calculations are allocated the average of the LSOA scores the grid square intersects. The maps below show these intersection counts, the maximum is 9.


The result of this is what my colleague Dan called naive smoothing; meaning a gradual transition from less to more (or visa verse) deprived areas. Whether this is a more realistic and intuitive mapping of deprivation I will leave to another occasion. This method obviously introduces fuzziness as the calculation assumes that a grid square that intersects LSOA does so with an equal area in each which is obviously not the case. The resulting map are shown below.


I have also gone up the scale from LSOA to Wards with IMD scores. As LSOA fall entirely inside the 624 wards no advantages/problems of naive smoothing. The maps are below;


Thursday, 14 October 2010

The problem of blogs and research journals

You may have noticed that I suddenly stopped posting my research without any explanation. It is not that I suddenly stopped working, I have been continuing to work quite hard, thank you. Its to do with the fact that over a glass of wine at one of these beginning of the new academic year mingle and be sociable events my supervisor gave me the task of writing a paper for a prestigious journal that peer reviews articles before acceptance. They not unreasonably expect original work that has not been published before. Now here is the problem. I "publish" rough and ready stuff on my blog. I had to and still having to decide what I can include in my blog that does not compromise the originality of my proposed paper. Of course the paper is a different style, it is more formal, more polished, more finished but it originates from the same brain, same data-sets, same journey. Where are the lines in the sand? Essentially it is my own integrity that is at stake here. I have to justify what I do to my self and I am sure that if persuade that judge who comes from a very puritanical background (thankfully tempered with a bit of compassion) I should be able to meet most peoples standards.

The real problem is one of timing and this where I think in this age where it is instantly possible to publish research that it is a tad unreasonable for journals to expect exclusivity unless they publish promptly. The fact is the process can be lengthy and it is not unheard of for a paper waiting two to three years before being published.

Research is a journey and my blog is a diary, yes a map of where I have been and where I am going. The argument is that I should continue but keep it to myself. I do not believe that is correct, I am publicly funded having the privilege of using data that in many respects is public, I feel that even though saying I have a duty to write a blog is overstating the case it has felt once I started that it is the right thing to do.

So my decision is I will continue to publish things as I do them and argue that the originality for journal publication is providing the rounded argument connecting different strands together in a formal and structured way. You certainly won't find any of that on this blog!!