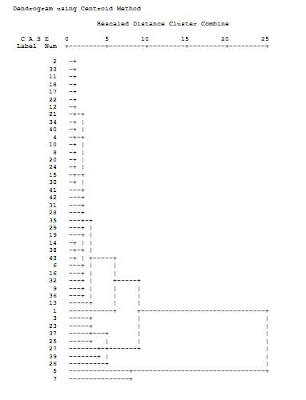
Just to continue with the visualisation of the centroid hierarchical clustering process - this is a dendrogram (all these new words I am learning!). It has taken me a bit of time to read what it is saying but I think I have got it. The reason why it is shown vertical as standard is because I think it should be read from the top left. If you remember the first merging of clusters (stage 1) was 2 & 33. Then it shows all the forces that are initially clustered with that cluster which becomes cluster 2. It becomes a bit complicated but it does logically tie in with the Agglomeration Schedule shown partially in the previous post. I have not gone into too much detail because practically it should be read from the right to the left, that is, as if the process was divisive.
If you now read this in conjunction with the maps and diagrams in the 3rd part of this series it all becomes quite straight forward.
It is actually very useful as it allows me to quickly see the similarities and variations produced by the different clustering methods.


No comments:
Post a Comment