Search This Blog

Thursday, 25 November 2010

Temperature and violence


This blog entry is dedicated to my colleagues in CASA, especially Andy Hudson-Smith, Ollie O'Brien and Fabian Nuehaus.

Yesterday I collected data from CASA's weather station for the 2009 calendar year. I have collated it for analysis and these are my first results.

The reason why I have written a blog entry for three weeks is that I have been writing a paper entitled `A Geographical and Temporal Analysis of Violent Crime in London in 2009' which hope to submit to a journal for publication. This has switched me on to the characteristics of violent crime that are different to other crimes. One of things I noticed was the affect of events such as New Year's Day had on violent incidents but also the weather.

I thought I would look into the weather aspect a bit further and I am able to thanks Andy and Ollie. The graph above does not look to promising. It shows the maximum temperature for each day in 2009 on the y-axis and the number of incidents that were allocated a code 1 class 'violence against person` and graded as an 'I` or emergency call on the x-axis. The result shows a very weak positive correlation. Nothing to get too excited about there then.

This where I thank Fabian for helping me to regard everything in police data as monitoring a machine (or a body) that has rhythms and cycles. Police incident data has rhythms and cycles that you can set your watch and calendar by.

You can see that number of calls is affected by the day of the week. Working on the hypothesis that the rhythms and cycles of London that are reflection of people's work/leisure routines have a greater influence than weather I negated much of this variable by just using Saturday data. I tried various combinations of weather data including average daily temperature and various different CAD codes in combinations or divisions. The best correlation I found was with CAD code 1 emergency calls and maximum temperature.


An R squared of  0.4417 means that temperature is not the only influence on violent incidents, holidays, celebrations, special events all play their part. These in some cases may be a contributory mechanism by which temperature is an influence, (eg hot May Bank Holiday weekends) and in others may be a negative influence (eg colder New Year's day( not on a Saturday in 2009) or Halloween). In any case the R squared value represents a correlation of  0.6646 which is generally regarded as significant in social sciences.

Friday, 5 November 2010

First Global Crime Map?


To go to the interactive map click here
I stumbled across this website. I like it for all sorts of reasons. The main one is because I think, in its way, this may be the first interactive global crime map. OK prove me wrong.

Monday, 1 November 2010

Venn Diagram with the example of Burglary in Dwelling

Venn Diagram with the example of Burglary Dwelling in London in 2009

 In the last posting I showed a Venn diagram of the relationship betwee CAD and CRIS. Today I have amended it slightly and populated it with numbers relating to Burglaries in Dwellings. You will notice that from the figures almost all the burglaries are repoted via a CAD incident. This is what I would expect as burglaries in people's home are a priority.

Drugs - Harm or Danger, or both?

I would just like to briefly comment on the current headline story "Alcohol 'more harmful than heroin' says Prof David Nutt" This appears to be an update on a previous Lancet Article in 2007 "Alcohol 'nearly as harmful as heroin'"

I know Prof. Nutt due to working on a Foresight Project Brain Science, Addiction and Drugs back in 2005 and the co-author Dr King who advised on a some drug trafficking research I was part of.
 
The aspect I would like comment on is the assessment of harms that is the basis of the research. From my understanding the same methodology could be used to come up with the headline "Sugar more harmful than Guns" or "Potatoes more harmful than Arsenic" or "Toasters more harmful than Nuclear Submarines".

In my opinion an assessment of harm should not be isolated from an assessment of risk. Prior to the Misuse of Drugs Act 1971 there were various Dangerous Drugs Acts.
 
We should be assessing what is dangerous as well as what is harmful.

Sunday, 31 October 2010

The Crime Record Information System CRIS discussed

Today I am discussing the Metropolitan Police Service Crime System, CRIS. I have just done a number of Google searches allow me to refer you to MPS or other sites that give background information about CRIS but there are none. So I will have to try my best to supply the relevant information.

My major first hand experience of CRIS was running a Crime Desk as Sergeant at Chiswick Police Station and then Hounslow Police Station when the two Divisions amalgamated as part of Borough Policing at the beginning of 1998. I went from a rather poor user of CRIS before the job to an expert in under 6 months due to working on it 7-10 hours a day. CRIS  has changed a bit over the years but not significantly from what I am able to tell from my searches of the system.

Unlike CAD, which is a system that is simple, elegant and clever due to it being designed from the start to maximise the strengths of computerisation, CRIS is none of those things for one basic reason, it totally copied the paper based crime reporting system that proceeded  it. Let me briefly take you through the history.

When I joined the police and for over ten years the way I would record and investigate a crime was by completing a paper crime sheet with a pen. These crime sheets had been developed over the previous 150 years of the Metropolitan Police history and were very good in ensuring that there were places to complete all the necessary details of the crime, show the investigation, suspects, people arrested, supervision, Home Office classification etc, etc. These were in a series of boxes and new sheets could be added as necessary. Different crime books were maintained. Major Crime, Beat Crime, Vehicle Crime, Burglary, Drugs and sometimes Robbery.

This is another very important point. The purpose of the paper record was to record crime and  its investigation; and be counted for official crime statistic purposes.

All that happened with computerisation was that the paper system with it series of boxes were turned into a computerised system with the same boxes which every police officer had to update like they were completing a written record.  No thought was given to how computerisation could actually make policing more efficient and effective. An opportunity was lost to free up police officers time, for instance, by having  specialist civilian operators taking reports from police officers at the scene of the crime . No thought was given to making the investigation details not free text but a series of searchable structured fields, or how the information could be used for intelligence and mapping purposes. The Metropolitan Police is still suffering from these short sighted decisions.

CRIS then is the definitive record of crime recorded by the police. Some of those crimes are recorded as a result of police incidents recorded on CAD. Others are reported over the telephone, via the Internet, at the front counter of police stations or  discovered by police, for instance after arresting someone, investigating another crime, etc.

Now this is where things get slightly complicated. There is a difference between that which is recorded on the CRIS - given a CRIS number - and that which is counted towards the official crime statistics. There are three main reasons for this;
  1. The CRIS record is initually of an allegation, after investigation and supervision the correct classification is given to the record. This is where good "housekeeping" can "legitimately" reduce the number classified as burglary, robbery etc. - the priority crimes.
  2. In the MPS all through my crime recording and investigation days were very straight forward with their crime recording - all allegations went in one system and were classified as crimes unless there was good evidence to show it was not a crime. I believe it was the practice in certain forces to keep the crime rate down and clear-up rate up for a dual system to operate where only crimes that were supported by good evidence went into the official crime book, the others were recorded separately and were only transferred across if more evidence was forthcoming. It seems that the spirit of this has been adopted by the MPS by creating something called the crime incident. This is to ensure that nothing that turns out no to be crime can possibly be counted in the official crime statistics. For instance, where the occurrence of a crime depends on the outcome of forensic tests; a CRIS record is created not as a crime but as crime incident so that a 7 day (it may have changed) classification rule does not apply.
  3. CRIS has filled the gap in the recording of non-crime incidents, most notably Domestic Incidents, known as non-crime domestic incidents. This means that nearly all CAD domestic incidents have a CRIS number; this only sometimes means a crime has been recorded.

Simple Venn Diagram Showing the relationship between CRIS and CAD

Friday, 29 October 2010

Police Incident Data Set Discussed

Police Crime Incidents involving a firearm in London in 2009 at Borough Scale

Legend - Number of Incidents

Police Crime Incidents involving a firearm in London in 2009 at Ward Scale

Legend - Number of Incidents


In this post I am going to start to tackle a difficult question but one which is very important to crime mapping and my research. You may find some aspects of the answer surprising, I do.

The question is "How do my two data sets, the police incident data set - Computer Aided Dispatch CAD and my crime data set  - Crime Recording Information System  CRIS relate to each other?"

This is a very important question as internationally the United States "crime" mapping systems for the public appear  to be almost exclusively based on their incident or call for service databases whereas in the UK the crime database is exclusively used.

The first thing to say is that the two systems I am taking my data from - CRIS and CAD were introduced into the Metropolitan Police long before computerised crime mapping became common place. The two systems where introduced for different purposes. So a bit of history.

When I joined the Metropolitan Police in the late 1970s computers where just being introduced but the police incident recording system was still 90% non-computerised. There was a dual system of central and local. Emergency calls (999) were routed to Information Room at New Scotland Yard who would assign local units with mainset radios to calls. The local police station communications room would be notified through a Message Switching System (MSS) which printed out the call onto a printer. This call would be placed on the A5 pad that had been started at midnight that day and given the next number in order. When the call was dealt with the result would been written on the sheet. The MSS system would also be used to send and receive messages from other police stations to be dealt with - bail enquiries, Please Allow An Officer To Call On (PAAOTCO), court warnings etc. In addition the local police station would have the non-emergency telephone calls routed to it (which were quite often emergencies). These would be manually written onto a message pad with the nature of the call the location, details of the caller, time and unit(s) assigned, and when the call was dealt with write the result. This was often  in local code abbreviations the actual meaning of which usually had a correct cover story but often a (politically) incorrect everyday usage. The Comms officer would use the local police station radio system to communicate with police units and be responsible for monitoring incoming calls. Back then as now there was a problem with capacity so the telephone operators would divert everything that was not needed to be dealt with by the uniform police response team on duty to other police offices.

This is the first very important point.  The police incident system does not and never has recorded all calls from the public.

In the early 1980s the CAD system was introduced,  first in New Scotland Yard Information Room and gradually over the next few years to the Police Stations control rooms around London to replace the paper system. Numbers replaced the words relating to the nature of the incident and the result. A graded response system was also introduced. This is how I knew the system when I last used it operationally in late 2004.

So for the next bit of history, bringing it up to the present day, I rely on second hand information from what I have learnt through conversation, MPS documentation and these two website sources. The first is from the MPS website here and the Wikipedia site here, which is accurate (in the main) but needs updating as the information is now at least two years old.

It appears that capacity has again been the problem which has meant that CAD system being supplemented by the Call Handling System and the introduction of three Information Rooms around the MPS to replace the Police Station Control Rooms and the New Scotland Yard Information Room.

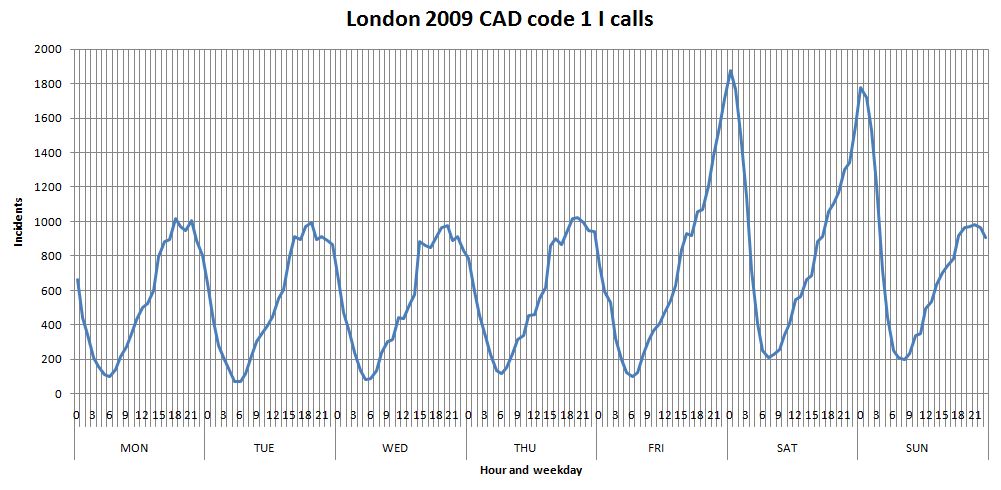
Call numbers are confusing. The MPS claims there are about 6,000 to 10,000 emergency calls a day and about 15,000 non emergency calls, a total of 21,000 to 25,000. The confusing bit is that within the emergency calls there are non-emergency incidents and visa versa. The result is that in 2009 there were about average of about 10,000 CAD incidents a day with a low of about 7,000 and a high of about 15,000. Of these about a third were dealt with as true emergencies - attend  as quickly as possible, a third not as emergencies at all - attend when police can or sort it out by other means, and a third as semi-emergencies, attend within the hour, if possible. This means that about another 10,000 calls are dealt with by the Call Handling System (CHS).

So in my analysis I have to be aware that if I confine myself to CAD data, which I have, and not delve into the into the CHS data, which I have not, then I am dealing with a subset of the total demand on police. I am reasonably confident, and I am working on this basis, that I am analysing a data set that has been selected by rules that are consistently applied throughout London over time. This I am assuming has produced a complete data set of incidents it is necessary to be referred to officers on duty to deal with. The filtering by call grading is a secondary part of this process.  

In the next post I will discuss CRIS and explain the maps at the beginning of this post. I think I has written enough for now.


Thursday, 28 October 2010

The deficiencies of Home Office Crime Type 1 exposed again

Home Office Crime Type 1 -Violence Against the Person in London in 2009 shown at ward level
Legend - number of crimes

In this recent post I discussed Home Office Crime Type 1 -violence against the person and the fact that only about 40% of crimes involving firearms in London in 2009 were included in that category. The above maps shown the geographic distribution of such crimes at ward level. I obtained the data from the Metropolitan Police website here

The correlation between locations at ward level of my data set of crimes involving firearms and HO type 1 is 0.53. This is a low figure given that the average member of the public would expect that in most cases that crime involving firearms should be included in Home Office Crime Type 1.